I’m currently writing a paper on a new Bayesian method for scoring Complex Span tasks. I needed some software to represent it using plate notation of a directed acyclic graph (DAG). Many people have pointed to the Tikz/pgf drawing library for latex, but I did not want to install latex for this simple task. Here I briefly review yEd, Daft, and Libreoffice Draw.
yEd
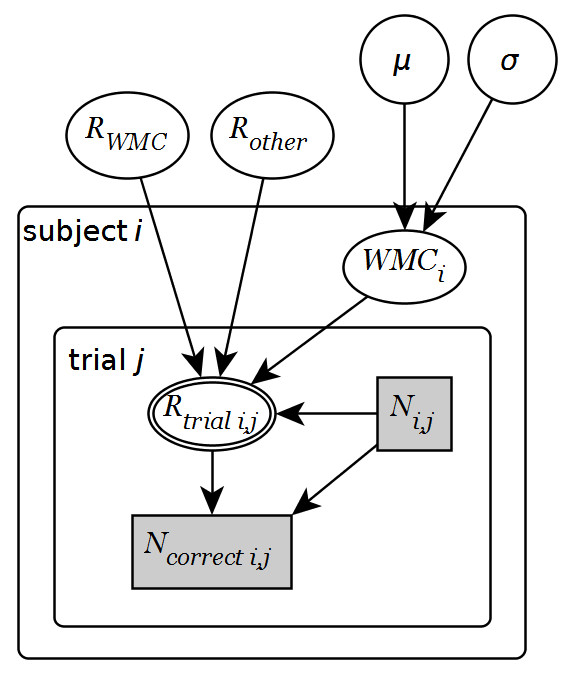
I ended up using yEd and produced this graph which contains plates, estimated nodes, deterministic nodes (double-lined), observed nodes (shaded), and categorical nodes (rectangles).yEd is purely graphical editing which is fast to work with and great for tweaking small details. A very handy yEd feature is its intelligent snapping to alignments and equal distances when positioning objects. Actually, I don’t understand why yEd almost never makes it to the “top 10 diagram/flowchart programs” lists.
A few things I learned: To make subscripts, you have to use HTML code. For example, the \(R_{trial_{i,j}}\) node is
<html>R<sub>trial i,j</sub></html>
However, it is not possible to do double-subscripts. Also, the double-edges node is made completely manually by placing an empty ellipse above another. I did not manage to align the \(WMC_i\) label a bit lower in the node. A final limitation is that arrowhead sizes cannot be changed. You can, however, zoom. Therefore, your very first decision has to be the arrowhead size. Zoom so that it is appropriate and make your graphical model. I didn’t think about this so the arrows are too large for me in the graph above.
I’m pretty pleased with the result. For the final paper I may try and redo this in Libreoffice Draw to see if I can fix the final details.
Libreoffice Draw
In retrospect, I think that Draw could have done better than yEd. First, you can scale arrowheads to your liking! Furthermore, you can write math in LibreOffice Math, so double-subscripting is no problem. However, you have to group a math object with an ellipse rather than entering it as “content”, which is a bit convoluted. Speaking of math, LibreOffice Math was great for entering the model specifications for the graphical model:
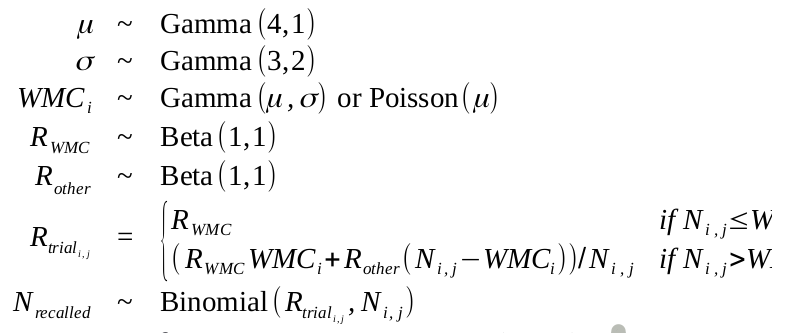
One small annoyance is that you have to choose between left-aligning everything including the denominators in fractions (which of course should be centered), or center-align everything. I would have liked a center-aligned denominator while left-aligning everything lines.
The above was created using the following code. The matrix was used to align the terms.
matrix{
    alignr %mu     # "~" # "Gamma"(4, 1) ##
    alignr %sigma  # "~" # "Gamma"(3, 2) ##
    alignr WMC_i   # "~" # "Gamma"(%mu, %sigma) " or Poisson"( %mu ) ##
    alignr R_WMC   # "~" # "Beta"(1, 1) ##     alignr R_other # "~" # "Beta"(1, 1) ##
    alignr R_{trial_{i,j}} # "=" # left lbrace matrix {
         R_WMC # if N_{i,j} <= WMC_i ##
         (R_WMC WMC_i + R_other(N_{i,j} - WMC_i))/N_{i,j} # if N_{i,j} > WMC_i } right none ##
    alignr N_recalled # "~" # "Binomial"(R_{trial_{i,j}}, N_{i,j})
}
I have to say that there’s something to the lacking snap-to-alignment and the general interface in Draw that makes it feel less nice than yEd, even though it is probably more versatile for the present purpose. I may update this blog post with a Draw model when I get around doing it.
Daft
Daft is a python module for rendering graphical models. The syntax is quite nice, but I quickly learned that you have to choose between shaded or double-edged nodes as indicators of observed variables. You cannot have both. You can draw an empty smaller node on top to make it double-edged, but using the \(scale\) argument makes it non-aligned with the outer line. I raised this as a GitHub issue [UPDATE: Check the GitHub issue – it has been fixed now! I haven’t updated this post], but Daft has not been maintained for years, so I don’t expect this to be fixed. Also, you have to install an old fork to draw rectangular nodes. This is as far as I got:
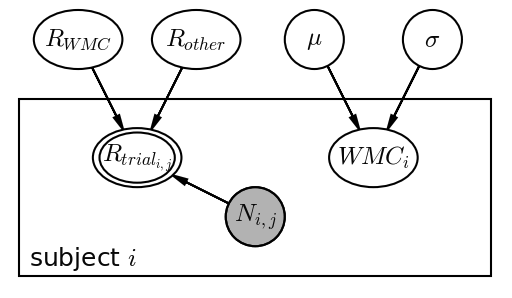
Here’s the code to do it, very much inspired (/ripped off) by this example.
# Set it up
import daft pgm = daft.PGM([5, 5], origin=[-2.5, -2.5])

# Nodes for R_trial
pgm.add_node(daft.Node('R_WMC', '$R_{WMC}', -1.5, 2, aspect=1.5))
pgm.add_node(daft.Node('R_other', '$R_{other}', -0.5, 2, aspect=1.5))
pgm.add_node(daft.Node('x', '', -1, 1, scale=0.85, aspect=1.5))

# Inner ellipse
pgm.add_node(daft.Node('R_trial', '$R_{trial_{i,j}}', -1, 1, aspect=1.5))
pgm.add_edge('R_WMC', 'R_trial')
pgm.add_edge('R_other', 'R_trial')

# Nodes for WMC
pgm.add_node(daft.Node('mu', '$\mu', 0.5, 2))
pgm.add_node(daft.Node('sigma', '$\sigma', 1.5, 2))
pgm.add_node(daft.Node('WMC', '$WMC_i', 1, 1, aspect=1.5))
pgm.add_edge('mu', 'WMC') pgm.add_edge('sigma', 'WMC')

# Observed N
pgm.add_node(daft.Node('N', '$N_{i,j}', 0, 0.5, observed=True))
pgm.add_edge('N', 'R_trial') # Subject plate
pgm.add_plate(daft.Plate([-2, 0, 4, 1.5], label='subject $i))

# Render it
pgm.render()
pgm.figure.savefig("daft graphical model.png", dpi=150)
Some notes
- Rob Zinkov posted an interesting argument on how generative stories can be used instead of plate notation.
- For those used to R, the ggdag package seems like a really convenient way to draw quick DAGs from formulas.