I predict that R overtakes SPSS in yearly citations by 2020. The implications are clear:
- If you use SPSS in your business or research, move to R now rather than later.
- Do not ask for SPSS competences in job postings. You will scare away the good candidates.
- We are doing students a disservice by teaching SPSS. Switch to JASP for simple one-off analyses and R for complex or repeated analyses. Rstudio Desktop is a highly recommended interface to R.
The numbers
The numbers have been clear for a number of years now that SPSS was on the decline. It was very clearly exposed by Robert A. Muenchen in a comprehensive 2016-analysis of the use of data science software. Robert looked at everything from job postings to online queries to academic citations. I have updated two of these analyses to include data from 2017 and 2018: Google Search Trends and citations in the academic literature.
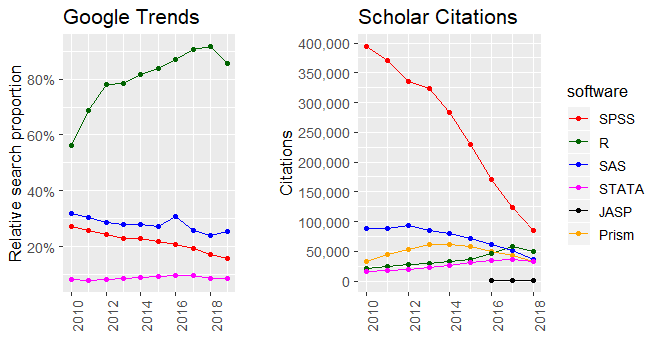
Here, we need to look at the trends rather than the absolute values for reasons I explain in the end of this post. Although R took a small dip in 2018, it is clear that it is getting traction. It is a good guess that R and SPSS will par citation-wise in 2019 and that R will have overtaken SPSS by 2020.
Let’s see why and what it means.
Why SPSS is dying
A few years ago, I wrote a blog about how a new GUI program, JASP, gets most things right, and how that exposing SPSS’s many shortcomings. SPSS simply feels old and unmaintained. Users have been screaming for simple statistics like Cohen’s d, confidence intervals on correlation coefficients, meta-analysis, etc., which has been a mandatory part of many major publication guidelines since 2000. This is not just some science formalia – these statistics are highly informative for industry as well. Despite repeated requests, SPSS has not implemented these, or many other standard statistical methods. SPSS now plans to change the GUI to match what JASP did four years ago.
SPSS simply feels old and unmaintained.
In addition, both industry and science now require greater reproducibility, transparency, and interaction with data. If you have ever tried using SPSS, you will know that it is fundamentally not fit for these.
Why R is surging
R saves you time. First, it is free, saving you (and your collaborators) time by not having to handle licensing and asking for budget approvals.
As a statistician, most of the time is spent pre-processing data before doing the statistics. Since the advent of tidyr in 2014, this has become incredibly easy to do. Perhaps more importantly, it has become much easier to read the code, which facilitates seamless collaboration and empowers you to learn much quicker from examples online. Pre-processing is often a non-linear process where you go back and forth. R is like editing a recipe in a text editor, and SPSS is like having to dictate the whole recipe on tape every time time you add a pinch of salt. JASP, by the way, is much closer to the recipe than the dictaphone.
[Concerning pre-processing,] R is like editing a recipe in a text editor, and SPSS is like having to dictate the whole recipe on tape every time you add a pinch of salt.
When researchers develop novel analysis methods, they will often publish them in user-friendly R-packages even before they publish the accompanying academic paper. For the most part, if you can think if it, it exists and is only one “install.package()” away. Not stumbling into software limitations saves you time.
Perhaps counter-intuitively, it turns out that students like programming (once they get started!) as it helps them better grasp what they are doing to the data than a point-and-click interface. In R, you can load data, pre-process it, and do a mixed model in just five relatively self-explanatory lines of code. It would take 20+ clicks in SPSS. If you want to do it for multiple datasets, you have to go through all that SPSS-clicking again (remember the dictaphone). It is really easy to miss a click and unknowingly get wrong results. Less repetition and debugging means more time saved in R.
After all, statistics is about the interaction and processing of variables. The same is true of programming. Therefore, programming requires less abstraction than graphical user interfaces. Programming is, of course, overkill for one-off analyses with little pre-processing. JASP, and its sibling Jamovi, are free graphical user interfaces to R that fills in this space.
Statistics is about the interaction and processing of variables. The same is true of programming. Therefore, programming requires less abstraction than graphical user interfaces.
Implications for industry and science
Consider SPSS a liability. Either weakly through taking more person-hours to use. Or strongly, through the increased risk of hard-to-detect errors.
Ask for R competences in job postings. If you ask for SPSS competences, you will select for applicants who are not up to date and filter out those who are, because they will want to avoid SPSS.
Consider SPSS a liability.
We should also stop teaching SPSS. Students spend a disproportionally large amount of learning the interface rather than learning the statistics. When they graduate, the cost of SPSS will incentivize them to avoid stats. JASP may be a good start for undergraduates because of the very shallow learning curve and sensible defaults. Then switch to R in the next semester to further empower the students. I have a few ideas (and a cheat sheet!) about how to improve stats teaching which would be easier in R.
Notes about the graph
The Google Trend values for R are likely inflated by the fact that R has a more technical audience which uses the internet more than SPSS users, who do less advanced analyses based on books. As a reflection of actual usage, we should probably just look at the trends which show that R is on the increase and SPSS is on the decline.
The absolute citation numbers in the graph is a bit misleading since it goes down while we know that the annual publication volume is increasing exponentially. It seems that we simply cite the analysis software less frequently than we used to. However, the relative popularity of software packages is still valid and R is close to overtaking SPSS.
To collect these data, I wrote a Google Scholar Scraper here (in R, of course) and I have posted the datasets here. I used Robert Muenchen’s search terms which I found valid. As a side effect, you can use this scraper to collect time-trends in all Google Scholar searches. I just happened to search for statistical packages.
Note that you need to update the full dataset to compare citations by year. For example, Robert found ~300.000 SPSS citations in 2011 where I found ~375.000 using the same search string. Google Scholar improves and more publications are retrospectively put online.
Pingback: How to Choose the Best Open Source Software – Linux Blimp
Pingback: Introduction to Descriptive Analysis / Descriptive statistics – Gahwan's Research Log