Update (Aug 7th, 2018): after reading this preprint by Liddel & Krusche (2017), I am convinced that it would be even better to analyzeLikert scales is using ordered-probit models. This is still a parametric model; just with non-metric intervals between response category thresholds. What I write below still holds for the non-parametric vs. parametric discussion.
Whether to use parametric or non-parametric analyses for questionnaires is a very common question from students. It is also an excellent question since there seem to be strong opinions on both sides and that should make you search for deeper answers. It is the difference between modeling your data using parametric statistics (means and linear relationships, e.g., ANOVA, t-test, Pearson correlation, regression) or non-parametric statistics (medians and ranks, e.g., Friedman/Mann-Whitney/Wilcoxon/Spearman).
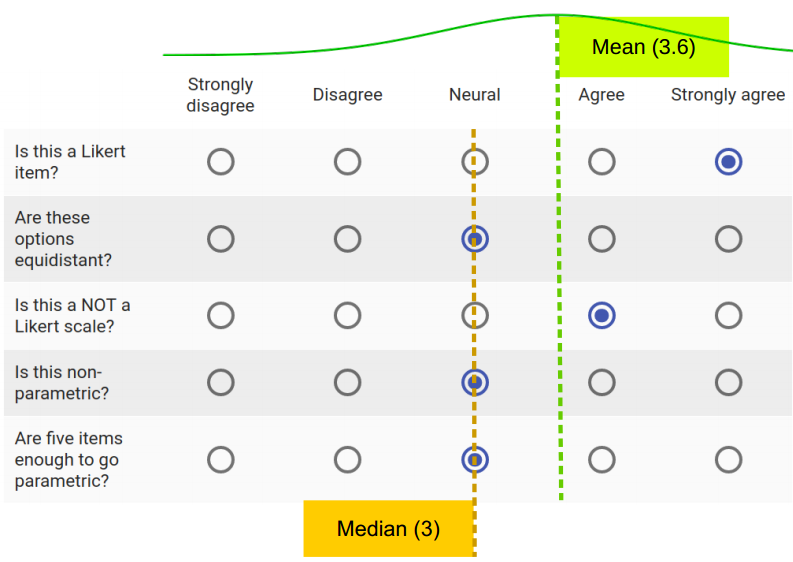
Consider this 5-item response. What do you think better represents this respondent’s underlying attitude? The parametric mean (SD) or the non-parametric median?
Here, we will leave armchair-dogma and textbook-arguments aside and look to the extensive empirical literature for answers. I dived into a great deal of papers to compose an answer to my students:
Be aware that this is a debate between the ordinalists (saying that you should use non-parametric) and the intervalists (arguing for parametric) which is still ongoing. So any answer would be somewhat controversial. That said, I judge that, for common analyses, the intervalist position is much better justified. The literature is big, but most of the conclusions are well presented by Harpe (2015). In brief, I recommend the following:
You would often draw similar conclusions from parametric and non-parametric analyses, at least in the context of Likert scales. For presenting data and effect sizes, always take a descriptive look at your data and see what best represents it. As it turns out, (parametric) means are usually fine for Likert scales, i.e., the mean of multiple Likert items. But (non-parametric) counts are often the correct level of analysis for Likert items, though this can be further reduced to the median if you have enough effective response options (i.e., 7 or more points which your respondens actually use). Due to measurement inaccuracy, interpreting single Likert items is often unallowably fragile, and no statistical tricks can undo that. So you should operationalize your hypotheses using scales rather than items as indeed all standardized questionnaires do. As you see from the above, this, in turn, means that your important statistical tests can be parametric. Because parametric inferences are much easier to interpret and allows for a wider range of analyses, it is not only an option but really a recommendation to use parametric statistics for Likert scales.
I would personally add to this that you should not dismiss the ordinalist-intervalist debate since its exactly the lines of thought that we ought to have when we chose our statistical model, namely to what extent the numbers represent the mental phenomena we are investigating. Others (e.g., the censor) may be ordinalists, so make sure (as always) to justify your choice using empirical literature. This makes your conclusions accessible to the widest audience possible. I provide here a short reading guide to help you make those justifications.
Reading guide
Students and newcomers are recommended to read the papers in the stated order to get a soft introduction. Readers more familiar with the topic can jump straight to Harpe (2015). I would say that Sullivan & Artino (2013) and Carifo & Perla (2008) gets you 75% of the way and Harpe (2015) gets you 95% of the way. Norman (2010) is included for its impact on the debate and because it presents the arguments slightly more statistically, but content-wise it adds little over and above Harpe (2015).
Note that this is an extensive literature, including some papers leaning ordinalist. However, I have failed to find ordinalist-leaning papers that did not commit the error of either (1) a conflation of Likert items and Likert scales without empirical justification for doing so, or (2) extrapolating from analysis of single items to analysis of scales – again without empirical justification that this is reasonable. If I learn about a paper which empirically uncovered that parametric analyses of Likert scales are unforgivingly inaccurate, I would not hesitate to include it. However, I feel like all major arguments are represented and addressed in this list.
- (15 minutes) Sullivan, G. M., & Artino, A. R. (2013). Analyzing and Interpreting Data From Likert-Type Scales. Journal of Graduate Medical Education, 5(4), 541–542. https://doi.org/10.4300/JGME-5-4-18
A light read for novices which could serve as an introduction to Likert-scales understood statistically and the idea of using parametric analyses on Likert data. However, it is too superficial to constitute a justification for doing so.
- (15 minutes) Carifio, J., & Perla, R. (2008). Resolving the 50-year debate around using and misusing Likert scales. Medical Education, 42(12), 1150–1152. https://doi.org/10.1111/j.1365-2923.2008.03172.x
A very concise list of arguments on the statistical side of the intervalist-ordinalist debate, heavily favoring the intervalist side for most situations. As a side note, this is a continuation and summary of Carifio & Perla (2007), but while the fundamental arguments of that paper are strong, it is so poorly written that I do not include it in this reading guide. Maybe this is why they needed this 2008 paper. - (60 minutes) Harpe, S. E. (2015). How to analyze Likert and other rating scale data. Currents in Pharmacy Teaching and Learning, 7(6), 836–850. https://doi.org/10.1016/j.cptl.2015.08.001
This paper introduces both the history, rating scale methodology, and empirically-based review of inferring ratio parameters (like means) from ordinal data (like Likert-items). Here too, the conclusion is that parametric analyses are appropriate for most situations. Most importantly, Harpe presents practical recommendations and nuanced discussion of when it is appropriate to deviate from those recommendations. Also, it has one of the most extensive reference lists, pointing the reader to relevant sources of evidence. As a reading guide, you may skip straight to the title “statistical analysis issues” on page 839 while studying Figure 1 on your way. Even though this paper is very fluently written, do take note of the details too because the phrasing is quite accurate. - (40 minutes) Norman, G. (2010). Likert scales, levels of measurement and the “laws” of statistics. Advances in Health Sciences Education, 15(5), 625–632. https://doi.org/10.1007/s10459-010-9222-y
This is the most cited paper on the topic, so I feel like I need to comment on it here since you are likely to encounter it. Recommendation-wise, it adds little new that Harpe (2015) did not cover. Some advantages of the paper are that it brings you to the nuts and bolts of the consequences of going parametric instead of non-parametric, e.g., by presenting some simulations and actual analyses. The paper is fun to read because Norman is clearly angry, but unfortunately, it also reads largely as a one-sided argument, so retain a bit of skepticism. For example, Norman simulates correlations on approximately linearly related variables and concludes that Spearman and Pearson correlations yield similar results. While this is a good approximation to many real-world phenomena, the correlation coefficients can differ around 0.1 when the variables are not linearly related (Pearson inaccurate) but still monotonically increasing/decreasing (Spearman accurate). This can change the label from “small” to “medium” cf. Cohen’s (1992) criteria which are (too) conventionally used.
Additional comments
Many “non-parametric” analyses are actually parametric. If the paper used the mean Likert rating of multiple items, they are largely parametric, no matter if they do non-parametric tests of this mean. This is because taking the mean embodies the parametric assumption that the response options are equidistant, e.g., that the mean of “strongly disagree” and “neutral” is “disagree.” Similarly, if the paper used Cronbach’s alpha to assess reliability or unidimensionality, they are parametric since it’s a generalized Pearson correlation, i.e., modeling a continuous linear relationship between Likert items. The vast majority of the academic literature does this, including every single standardized questionnaire. A practical consensus is not a convincing defense of going parametric on Likert data, but it does indicate that it requires little to get to the level of current publication practices.
Prediction of responses to single items must be ordinal. Predictions of responses should only yield actual response options. E.g., not 2.5 or 6 on a 5-point Likert scale. For scales or predictions across subjects (i.e., the mean of items) the parametric estimate will often be good enough. I have not found literature which has tried to predict responses on individual items by individual subjects, but if you were to do so, you would have to do some transformation of the inferred parametric estimates back into predicted discrete ordinal responses (e.g., probit transformation).
Multilevel models are superior. Always beware when “manually” computing differences, means, analyzing subsets of data, etc. since you usually through away valuable data. Similarly in the context of Likert scales where you compute a mean. It is self-evident that the mean of 100 items would much better approximate the true underlying attitude of your respondent than the mean of 4 items. Yet, Mann-Whitney U or other analyses would not “know” this difference in certainty. Multilevel models would much better represent the data, seeing the response to particular items as samples of a more general attitude of the respondent (with a mean and a standard deviation) rather than pure measures. However, I have not presented or discussed multilevel solutions above, since the learning curve can be steep and the classical scales-as-means approach is accurate enough for most purposes.